Most appointment-based franchise brands can tell you two numbers quickly:
- How many leads came in this week
- How many appointments were completed
What many teams still cannot answer clearly is the operational question between those two numbers:
How efficiently did inquiries become booked appointments across every location?
That gap is where revenue performance gets decided.
When leadership only reviews top-of-funnel demand and final outcomes, they miss the middle-stage execution quality that drives both. That is why inquiry-to-booking rate should be treated as a core operating KPI, not a reporting afterthought.
It is the metric that ties together the system described in /blog/speed-to-lead-franchise-revenue-engine, /blog/no-show-recovery-franchise-revenue-system, and /blog/franchise-customer-reactivation-revenue-engine.
What Inquiry-to-Booking Rate Actually Measures
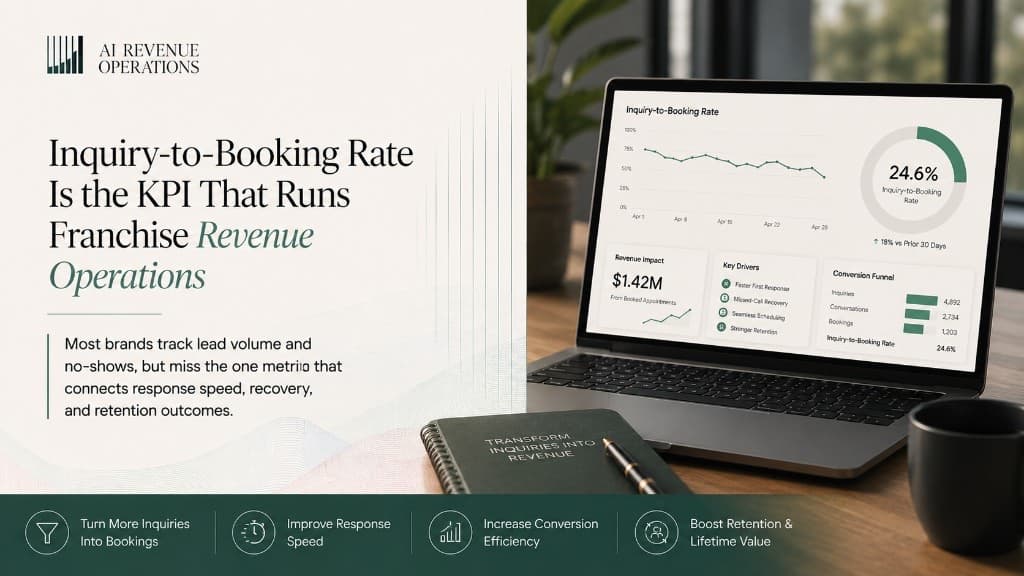
Inquiry-to-booking rate is simple:
Booked appointments / qualified inquiries
The value is not the formula itself. The value is using it as an operating lens by location, channel, and response-time cohort.
When measured correctly, it tells you whether your network is converting intent into scheduled revenue.
It also exposes where execution is breaking:
- intake routing
- response speed
- follow-up discipline
- booking friction
- no-show recovery handoff
If those stages are weak, lead volume can increase while booked revenue underperforms.
Why This KPI Is More Useful Than Lead Volume Alone
Lead volume is input. Inquiry-to-booking rate is throughput.
A franchise network can have stable demand and still lose bookings if location execution is inconsistent.
Recent franchise coverage has continued to emphasize the shift from traffic obsession to conversion discipline in multi-unit systems. The practical implication is clear: operators need metrics that expose process quality, not only activity totals.
Treating inquiry-to-booking rate as a weekly operating metric gives leadership three advantages:
1. It aligns marketing and operations
Marketing owns demand generation. Operations owns execution quality.
This KPI creates one shared accountability point instead of two disconnected dashboards.
2. It isolates process failure from demand quality
If inquiry quality is stable but conversion drops, the issue is likely operational.
If conversion is strong but total bookings are still low, the issue is likely demand volume or mix.
3. It makes location coaching specific
Instead of broad coaching like "follow up faster," leaders can coach exact failure stages:
- missed-call callback delay
- low second-touch completion
- weak reschedule capture
- low confirmation completion
The Multi-Location Reality: Variance Is the Main Risk
At single-unit scale, one strong manager can mask weak systems.
At franchise scale, variance compounds.
Two locations can receive similar inquiry volume and produce very different booked outcomes because one runs tighter response workflows and one relies on ad hoc effort.
Without a consistent inquiry-to-booking scorecard, corporate teams cannot tell whether underperformance comes from market conditions or operating drift.
This is the same structural problem outlined in /blog/multi-location-revenue-gap: growth leakage happens in handoffs, not only in acquisition.
Build the Metric Stack Around the KPI
Inquiry-to-booking rate should sit inside a short supporting KPI stack reviewed weekly by corporate and location leaders.
Use this minimum set:
- Inquiry-to-booking rate
- Median first-response time
- Percent of inquiries contacted within SLA
- Missed-call callback time
- Booking confirmation completion rate
- No-show rate on newly booked appointments
This stack gives context. If inquiry-to-booking declines, teams can identify exactly which upstream stage moved.
Segment the KPI Before You Compare Locations
A common mistake is comparing locations on one blended percentage.
Segment first, then compare:
- by inquiry source (calls, forms, paid campaigns, referrals)
- by service category
- by daypart
- by response-time bucket (for example, <10 min, 10-30 min, 30+ min)
This prevents false conclusions and makes interventions measurable.
Example: if one location has lower blended conversion but strong sub-10-minute performance, the issue may be staffing coverage during high-volume windows, not script quality.
A Practical Operating Cadence
For appointment-based franchise brands, this cadence works:
Daily
- Auto-flag locations below SLA for first response
- Auto-flag missed-call callback breaches
- Route exceptions to location manager queue
Weekly
- Review inquiry-to-booking by location and source
- Compare top-quartile and bottom-quartile locations
- Assign one process correction per underperforming location
Monthly
- Evaluate systemic patterns by region and brand segment
- Update workflow rules, not just coaching notes
- Rebalance demand spend only after execution quality is stable
This cadence keeps accountability tight without creating reporting noise.
A 30-Day Rollout Plan
You can operationalize inquiry-to-booking management quickly.
Week 1: Standardize definitions
- Define what counts as a qualified inquiry
- Define what counts as a booked appointment
- Publish one SLA table for first response and callbacks
Week 2: Instrument and baseline
- Build location-level scorecards
- Segment by source and response-time buckets
- Capture baseline inquiry-to-booking by location
Week 3: Correct highest-leak stages
- Fix missed-call callback lag
- Tighten form-to-first-touch routing
- Add escalation rules for high-intent inquiries
Week 4: Enforce operating reviews
- Add KPI stack to weekly leadership review
- Coach bottom quartile with top-quartile process examples
- Lock standards into recurring workflows
The key is consistency. One-time audits do not change network performance.
How This Connects to Revenue Engines 1-3
Inquiry-to-booking rate is not separate from other revenue systems. It is the connective metric.
- When speed-to-lead improves, inquiry-to-booking should rise.
- When no-show recovery improves, effective booked revenue per inquiry rises.
- When reactivation improves, repeat inquiry-to-booking dynamics strengthen over time.
That is why teams should stop treating conversion, recovery, and reactivation as unrelated dashboards.
One operating KPI framework should connect all three.
Final Take
Franchise growth gets noisy when teams optimize isolated metrics.
Inquiry-to-booking rate gives leadership one clean view of whether the operating system is turning demand into scheduled revenue.
If your network is not reviewing this KPI weekly by location and source, the organization is likely reacting to lagging outcomes instead of managing real-time execution.
TractionDesk is built to help appointment-based franchise brands run these workflows with one operating layer across locations, so revenue performance improves through repeatable execution rather than constant firefighting.
If you want to pressure-test your current model, start by calculating inquiry-to-booking rate for each location this week and segment it by response-time bucket. The biggest leak usually appears fast.